Doctors By Gender By Year
Fri Sep 11, 2015
Medicare has data on every physician in it’s system that includes information about each physician’s year of graduation, primary specialty and gender. This data is about as good as it gets in terms of looking at national trends so I’ve made a few plots that highlight the male/female ratios in medical subspecialties.
Summary
- Doctor Specialty by Gender by Year
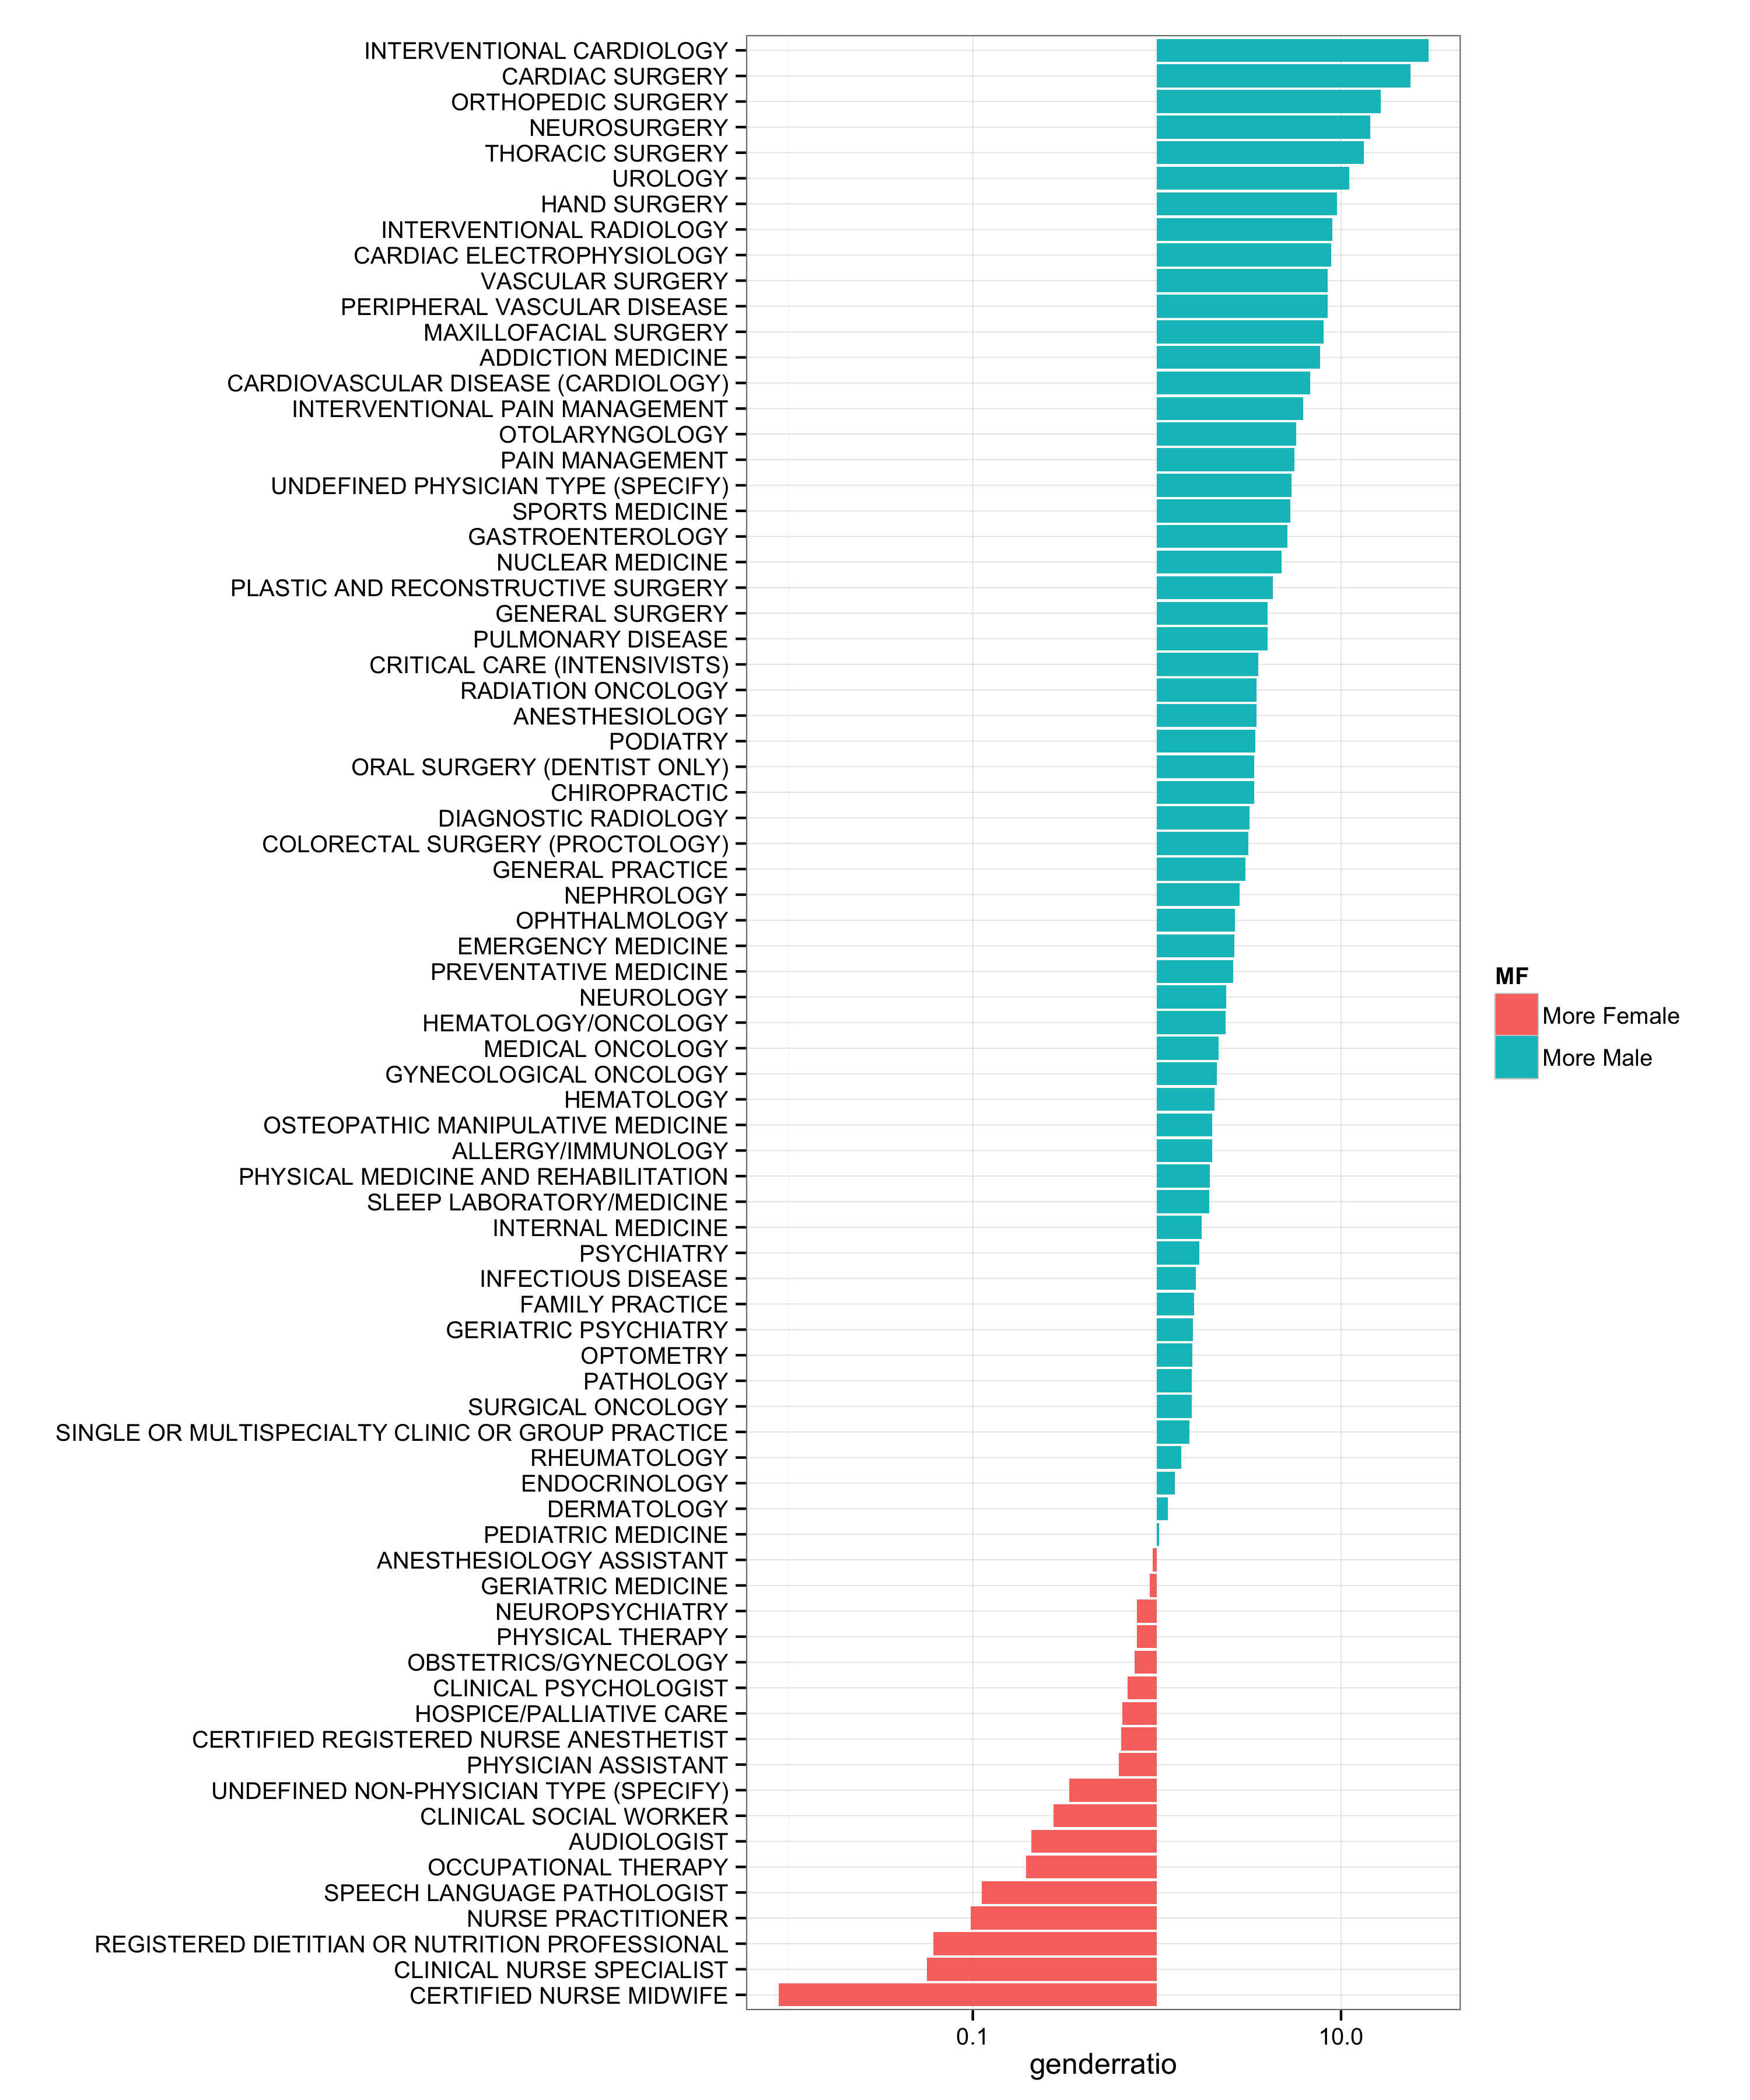
- Some traditionally female-dominant professions like midwifery and social work remain mostly female.
- Women have major gains in OB/GYN, Family Practice, and Internal Medicine.
- Men still dominate in surgery: Ortho-, Neuro-, Thurasic-, Vascular-.
- In the desirable “easy” specialties sought after on match-day it looks like M/F is 50/50: dermatology, allergy/immunology, and to a lesser extent anesthesiology and radiology.
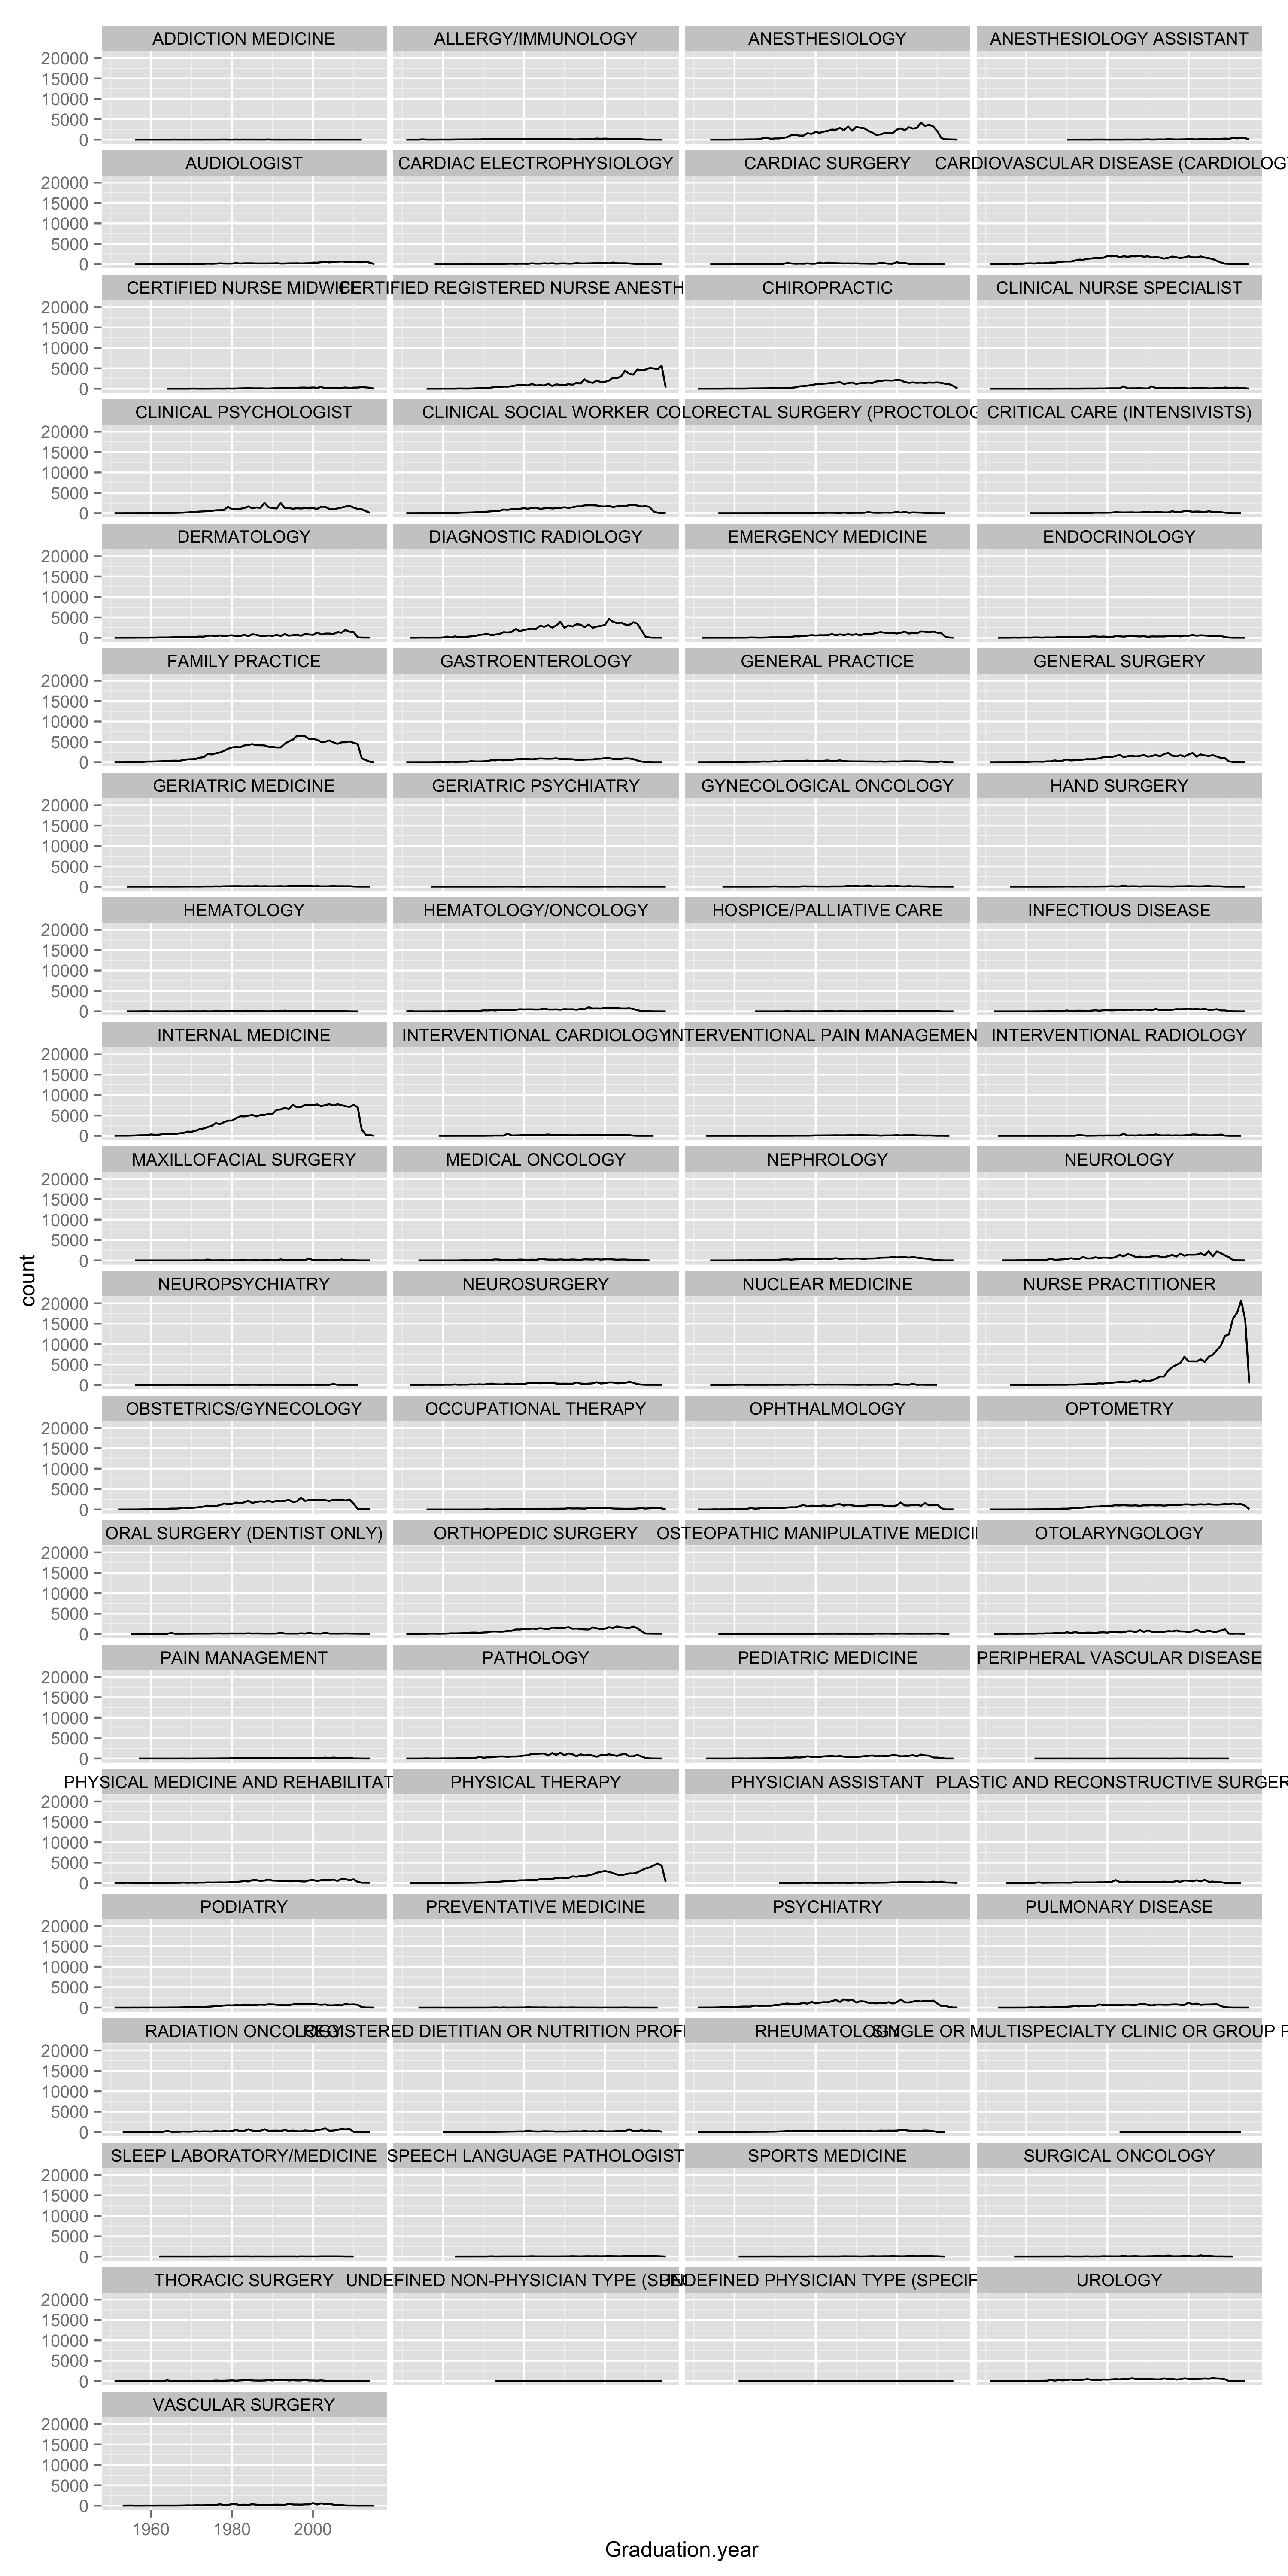
- Doctor Specialty by Gender by Year
- Using fixed scales this time around: there are a lot of nurses.
- Gender Skew by Specialty
- Summary of (1) although you don’t see the recent participation gains by women.
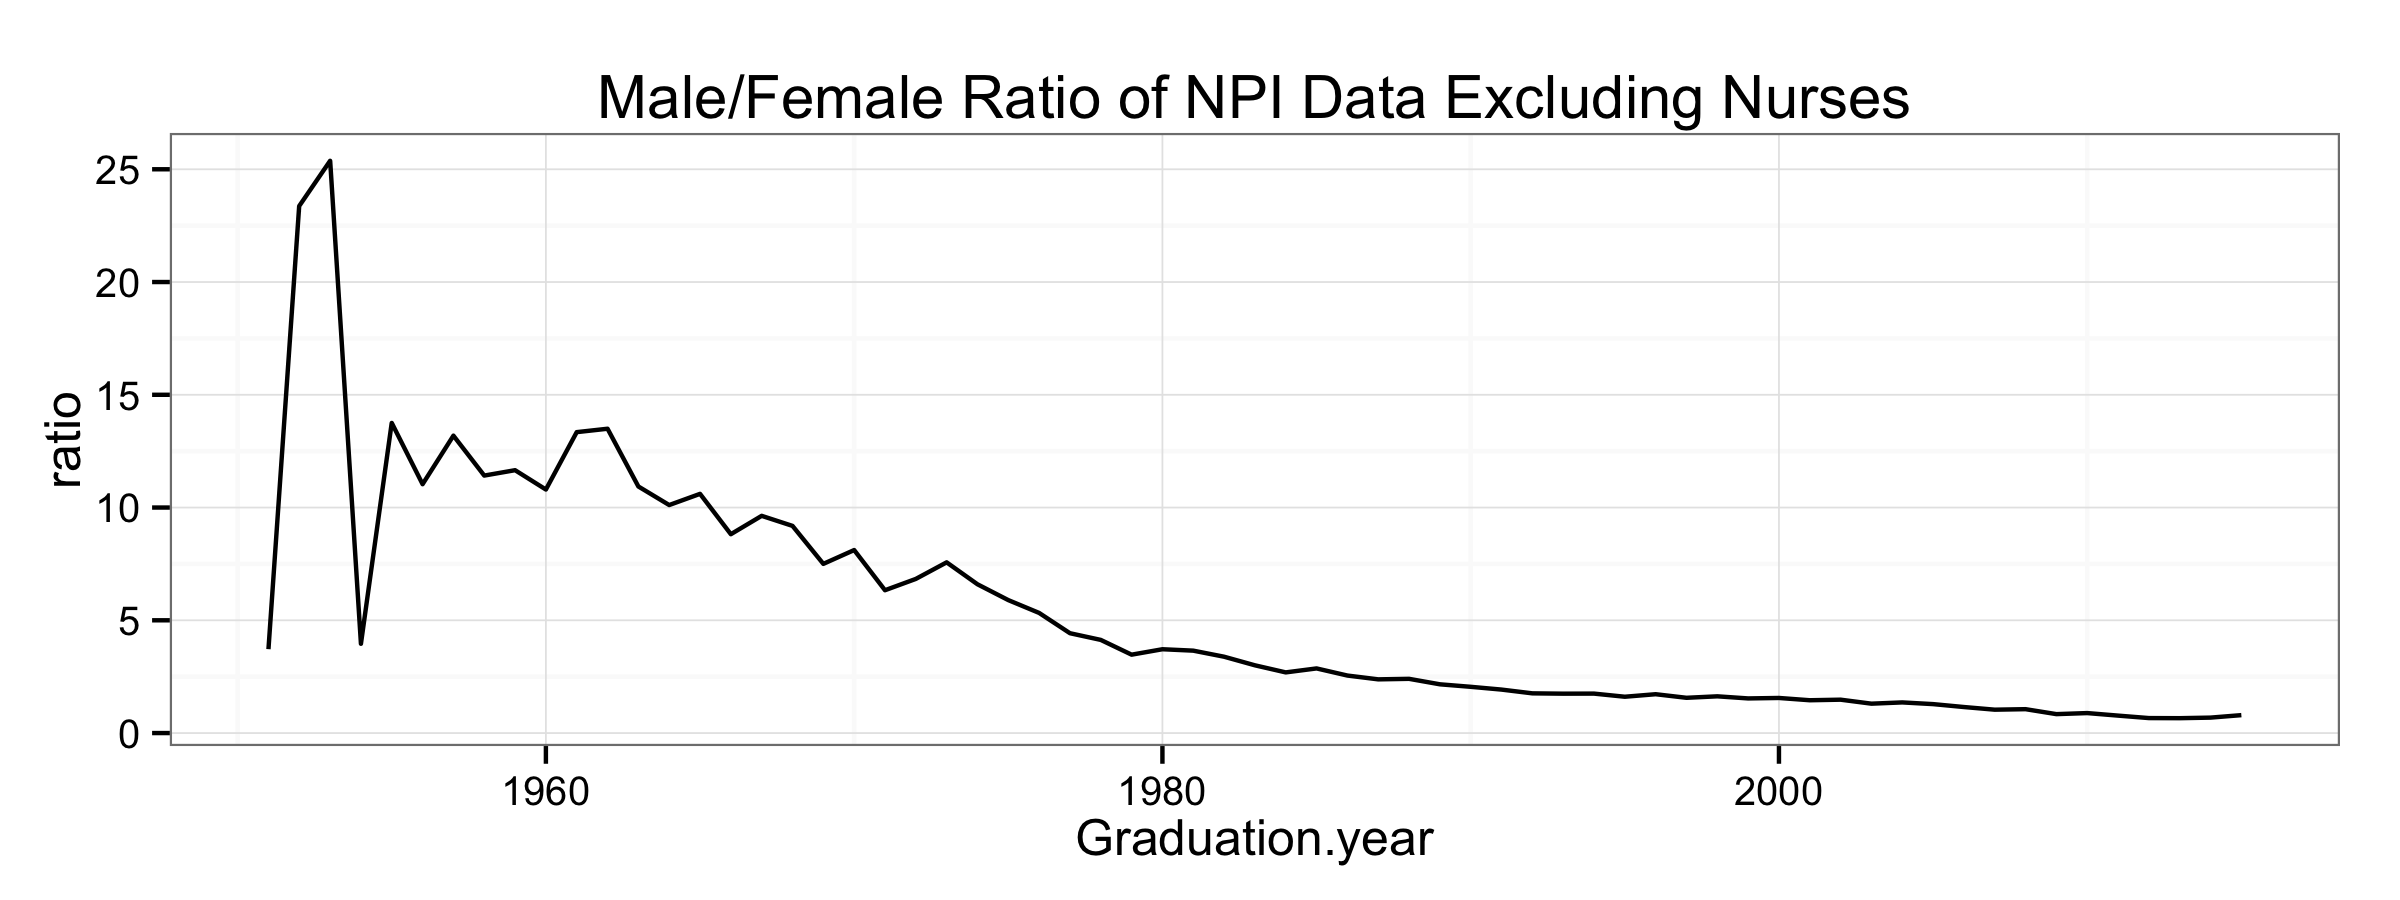
- Male/Female in Med School
- Looks like Gender ratio is even for recent Med grads with possible slight edge to women.
Doctor Specialty by Gender by Year

Doctor Specialty by Gender by Year
Gender Skew by Specialty
Note: this is all data so many things look more male-skewed.
Male/Female in Med School
This data should let us assess the ratio of males to females graduating medical school assuming that the graduates practice medicine. I have eliminated the two most populous nursing categories to focus on physicians. Although you can’t tell from this view, the ratio dips below 1 in 2008 and remains there. Are there more women graduating medschool than men?