Small Multiples Map
Sun Jan 17, 2016
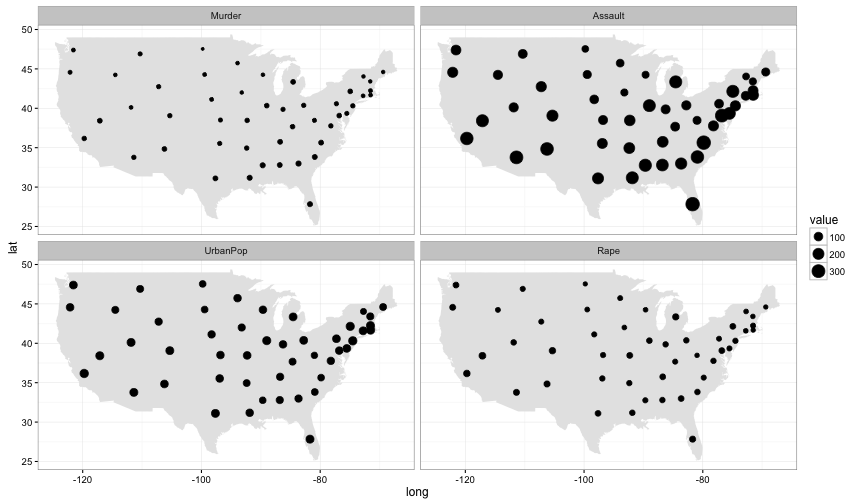
Despite using R and its various graphing facilities I have somehow managed not to have stumbled across Bob Rudis. I recently noticed his ggalt package which has some similarities overlap to stuff I have tried to do in phylogeo. This inspired me to give a quick whirl to the small-multiples style of charts, of which the following is a small, reproducible example. When put into combination with the updated projections and higher-res mapdata of the [maps package] (https://cran.r-project.org/web/packages/maps/README.html): (natural earth 1:50m.)
After googling around looking for some links I’m seeing some really nice maps made with the current R-geography stack. Check out Austin Wehrwein and Bob Rudis. Very nice. I love d3.js for maps but its tough to compete with R for making static maps within your analytic workflow.
So heres a simple small multiple map with ggplot, and ggalt.
Loading the data
library(dplyr)
library(ggplot2)
library(dplyr)
library(ggplot2)
library(ggalt)
data("USArrests")
#get data
dflats     <- read.csv(file="http://dev.maxmind.com/static/csv/codes/state_latlon.csv", sep=",")
twoletters <- read.csv(file="http://voice.firefallpro.com/files/state.csv", sep=",")

crimedf <- USArrests %>%
    add_rownames(var = "state") %>%
    reshape2::melt() %>%
    left_join(twoletters, by=c("state" = "name_long")) %>%
    left_join(dflats,     by= c("name_short" = "state")) %>%
    filter(!name_short %in% c('AK','HI'))

usa <- map_data("usa")
ggplot() +
    geom_map(data = usa,
             map=usa,
             aes(x=long, y=lat, map_id=region), fill="gray90") +
    theme_bw() +
    geom_point(data=crimedf,
               aes(x= longitude, y=latitude, size=value)) +
    facet_wrap(~variable)