plotting images by extending ggplot
As a followup to a recent post on the use of ggrepel’s placement code to place images on maps, I wanted to do a better job of hooking into ggplot’s extensibility mechanism. In order to benefit from ggplot’s handling of variables I really wanted to have a column where I could add ggplot object. Then my imageGrobs could be passed around like any other value. That is not possible. However, it is possible to use strings corresponding to image file locations. How hard would it be to modify the excellent ggrepel package to support handling of images? Fortunately, as Kamil has done all of the hard work, the answer is: not very. Below I outline the basic workings of a ggplot geom that lets you use filenames to plot PNGs into your ggplot. Gist of the code is here. To use this code you will need the geom_point_repel branch of my ggrepel fork.
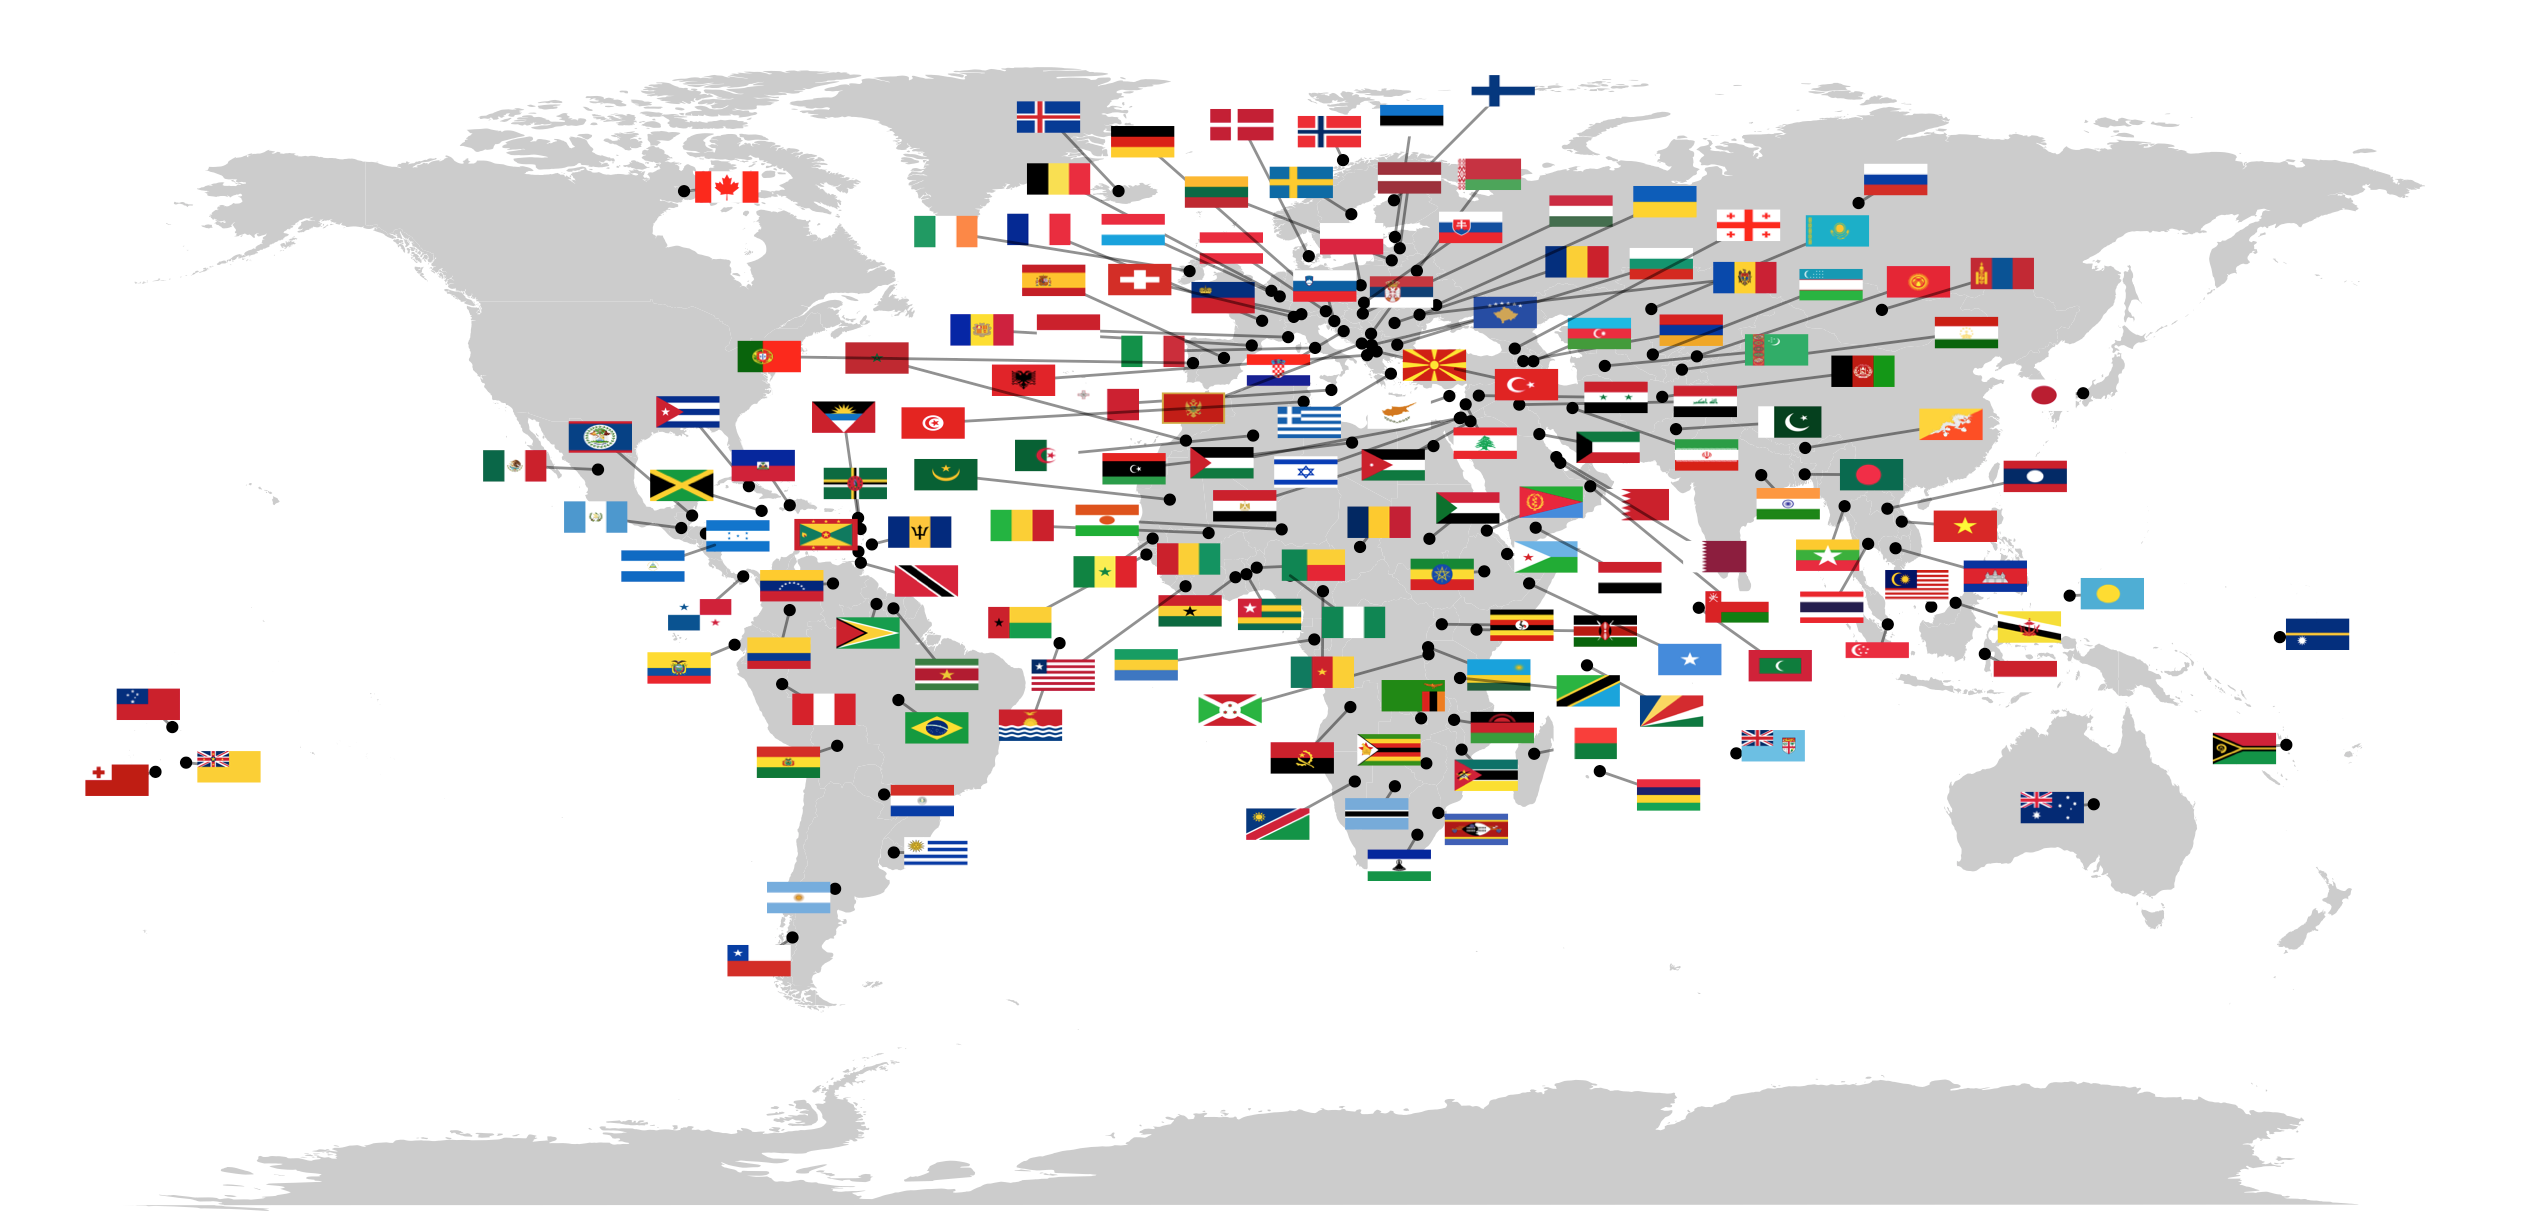
Flagmap Update#
# using the same setup as the earlier post
# I will plot flags on a map
world <- map_data("world")
gg    <- ggplot(world)
gg    <- gg + geom_map(
                data=world,
                map=world,
                aes(x=long,y=lat, map_id=region),
                fill="grey80")

# note that all images are plotted here using the geom_image_repel line
gg +
  geom_point(data=flagfiles,  aes(x=long,y=lat)) +
  geom_image_repel(data=flagfiles, aes(x=long,y=lat, image=pngfile), width = 0.025)

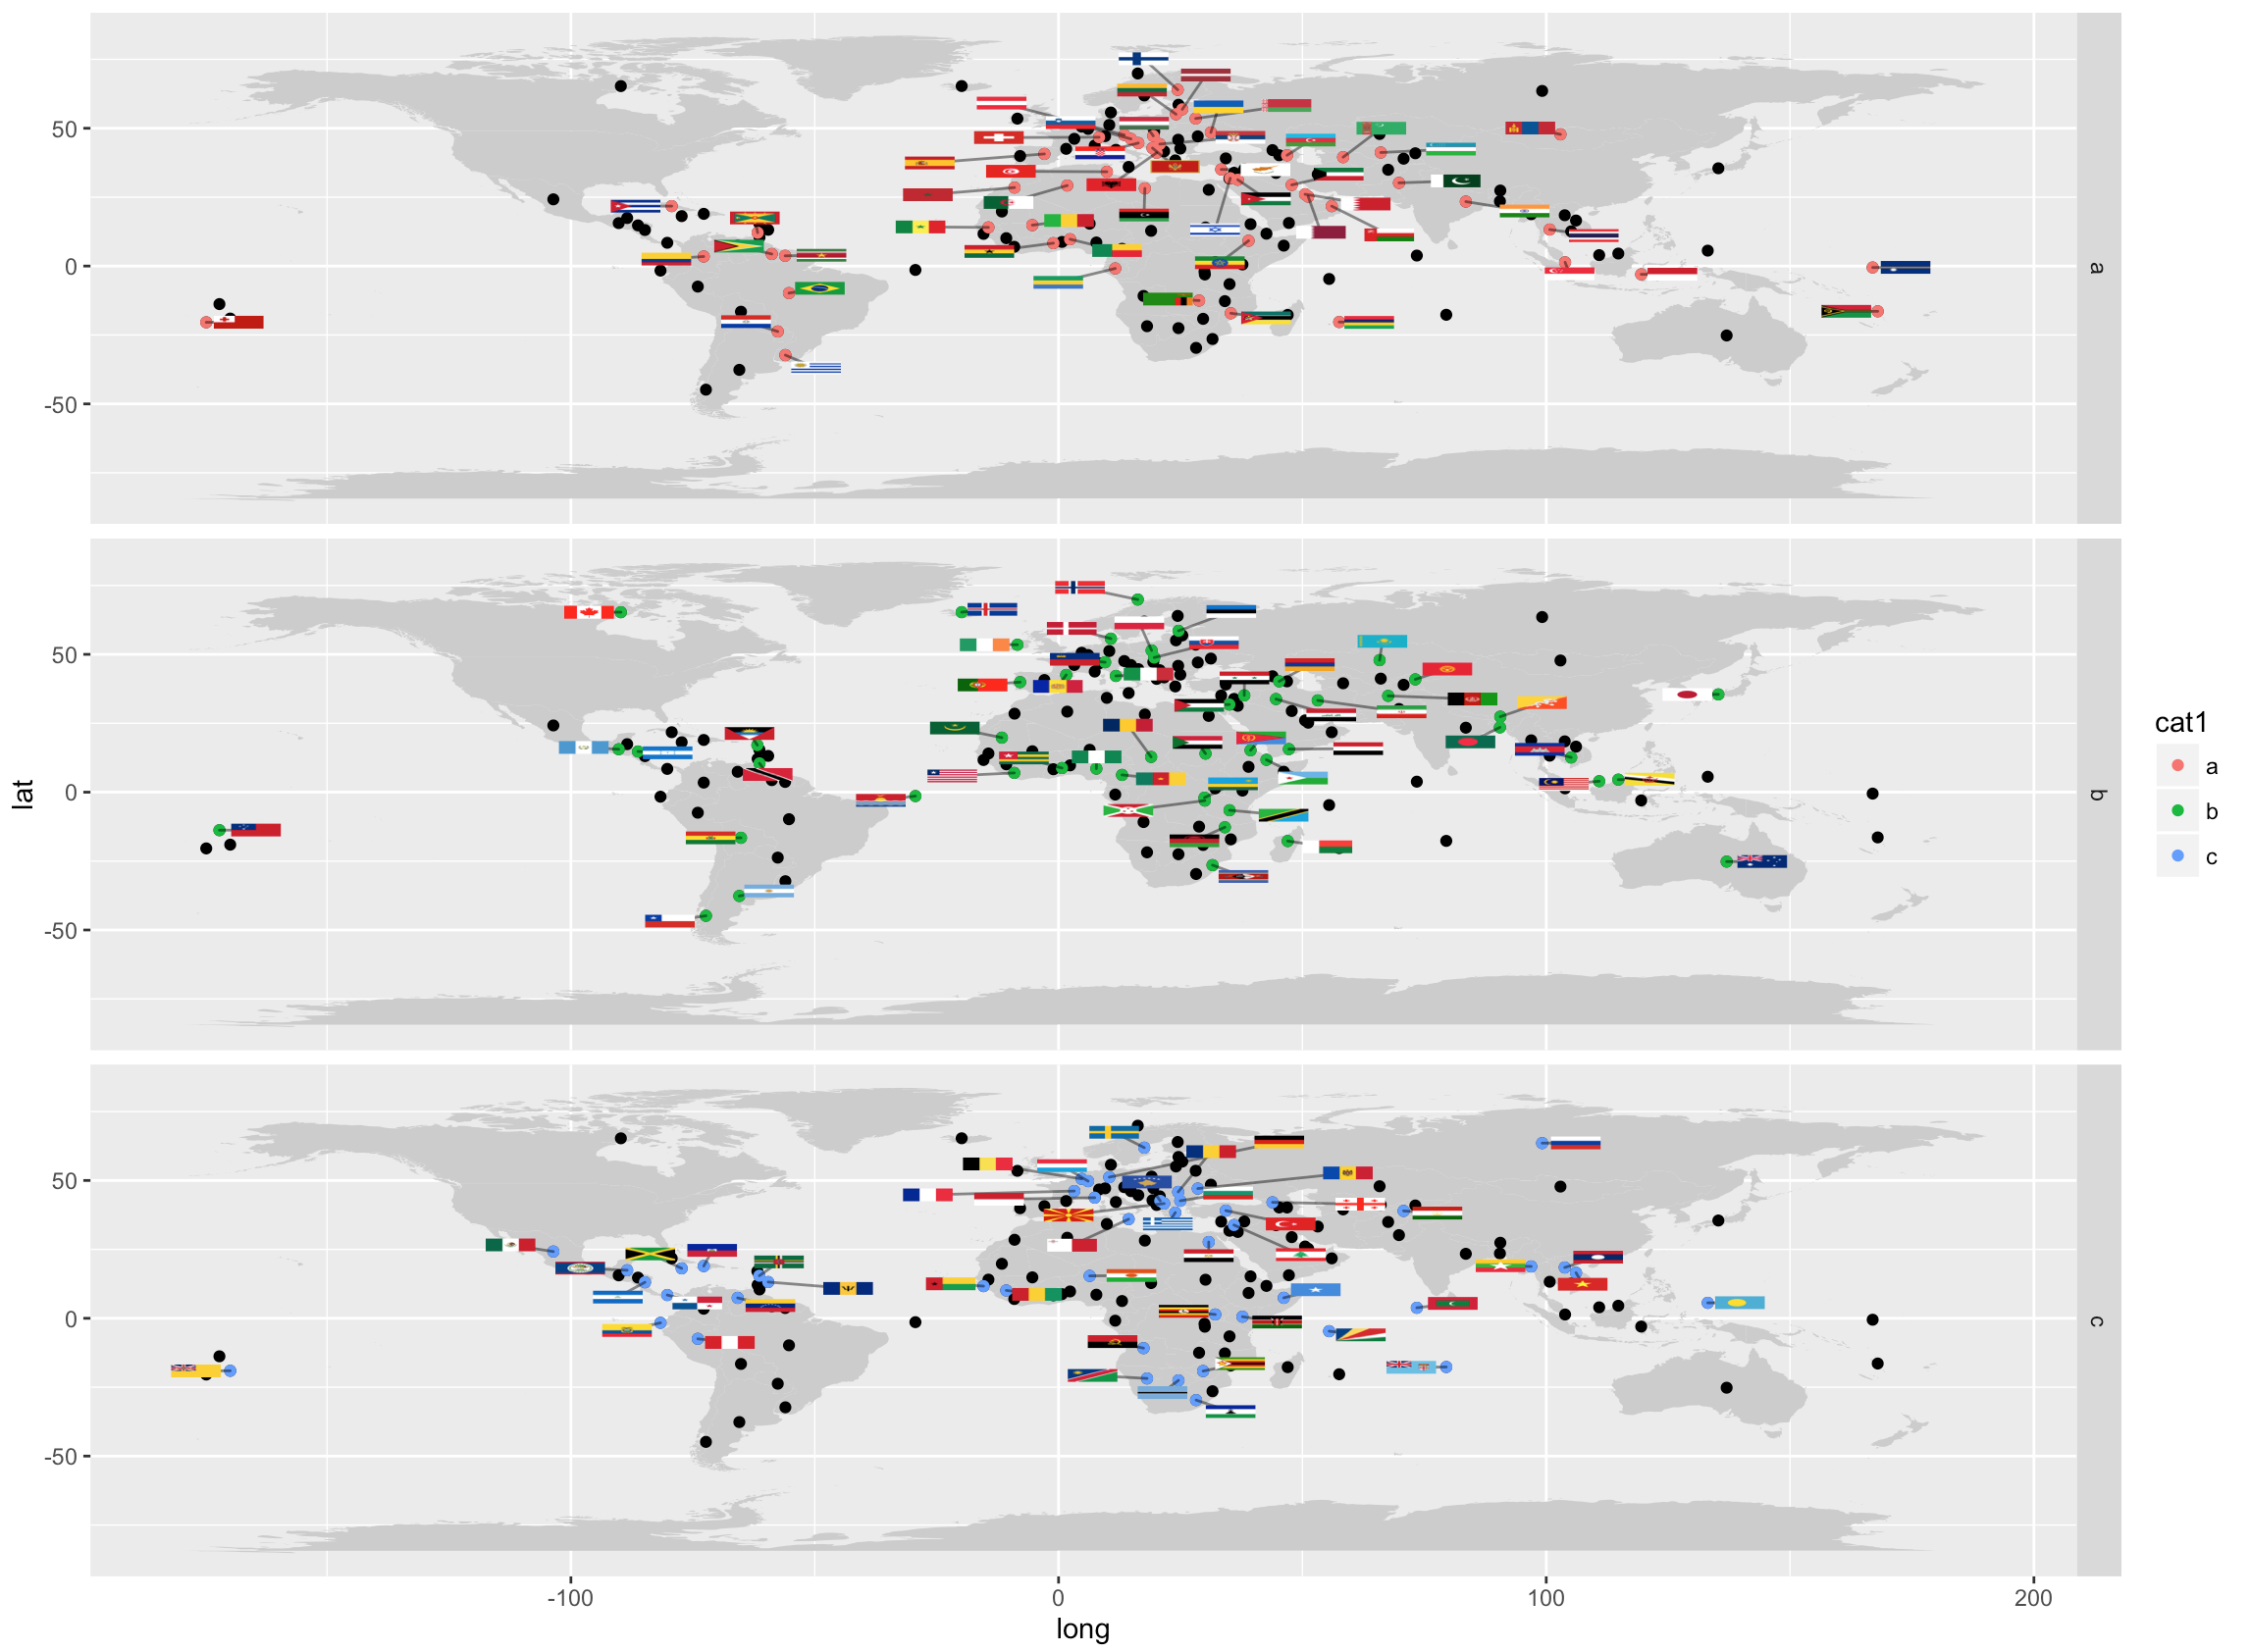
Flagmap with Facets#
Everybody loves facetting and by extending ggplot you get all the facetting goodness you want for free:
#add a dummy column and facet by it
flagfiles$cat1 <- sample(c("a","b","c"), replace = TRUE, size = length(flagfiles$flag))
gg +
  geom_point(data=flagfiles,  aes(x=long,y=lat, color=cat1)) +
  geom_image_repel(data=flagfiles, aes(x=long,y=lat, image=pngfile), width = 0.025) +
  facet_grid(cat1~.)

This geom needs some polish but I can see a lot of potentially awesome uses for it! Thanks to Hadley, Kamil and ggploters.