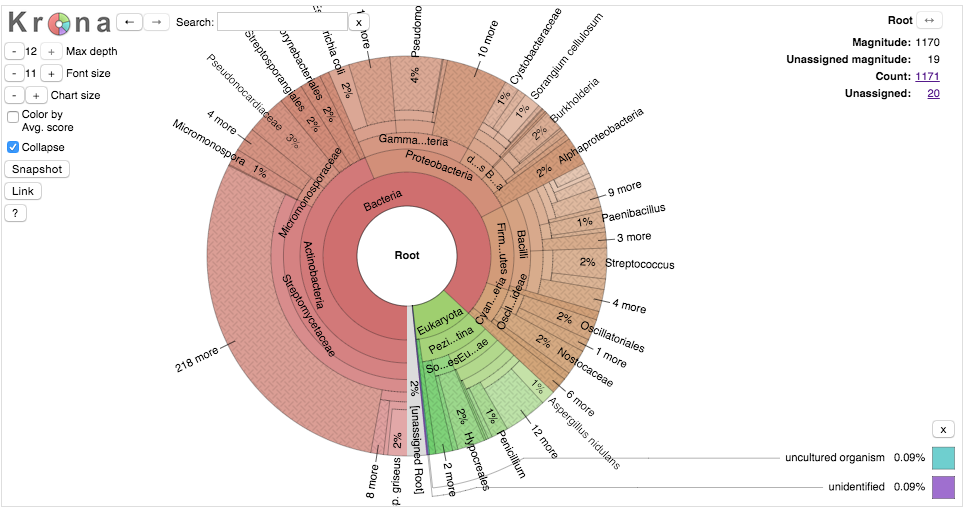
Krona Chart of the Mibig Dataset

I’ve just made a KronaChart of the Mibig dataset which you can check out here. Krona is a nice tool that lets you zoom zoom around the ~1200 gene clusters deposited and annotated in Mibig. Although there might be a little bit of deposition bias, its pretty clear what the major players phylogenetic players are in terms of small molecuel production. First off, bacterial gene clusters account for nearly 90% of all of the reported clusters with most of the remaining of fungal origin. Although we know that plants are a rich source for bioactive compounds they are more difficult to look at computationaly because they lack the selective pressure required to maintain all the realted genes in the same spot on the chromosome. Transposition creates another set of problems for annotation. Among the bacteria Actinobacteria are, unsurprisingly, the dominant genus, make up 44% of all biosynthetic gene clusters in the database and 50% of all bacterial clusters.
This is a fun way to look at the Mibig datat= and I am sure there will be more substantial insights coming from it. Thanks to the Mibig Team for wrangling this information into a single, easy to use format.
Edit
Added a second gist with Mibig Clusters organized by biosynthetic class and subclass information.