topic histograms of PUBMED using eutils CLI
I’ve needed to download and bulk analyze some abstract data from Pubmed and have taken this as an opportunity to familiarize myself with their eutils command line interface. The command line interface to eutils gives you full access to NCBI’s many databases but allows you to perform queries in a sophisticated way. The few, core set of commands can perform fairly sophisticated analyses by chaining the calls together with pipes, unix-style. esearch, efilter, and efetch are the primary means of looking for, filtering and obtaining data, while the xtract command parses the XML data from NCB into useable formats. The examples in the documentation in the link above are enough to get you started and to see how the tools let you explore the data (i would use a filter on the big searches to reduce search time) and iterate the discovery/retrieval process
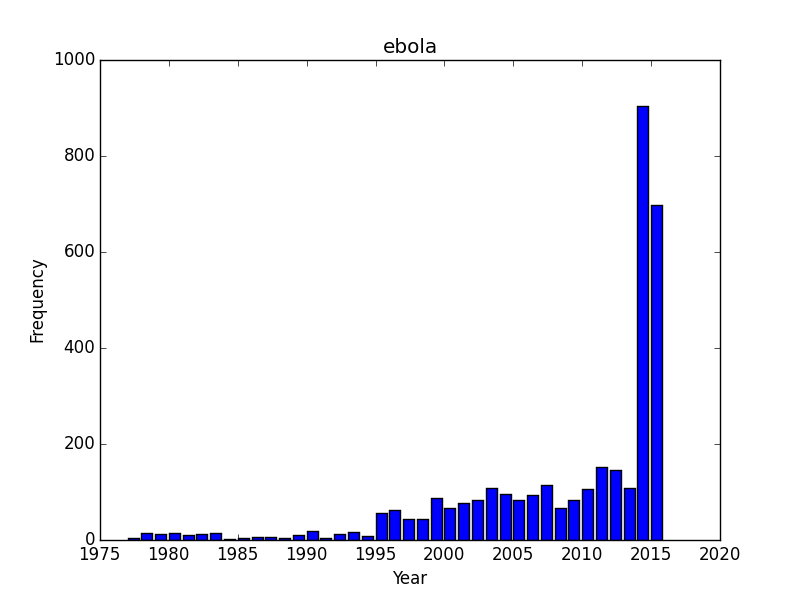
As an example here is a PUBMED search for ebola where I am only interested in the number of articles per year. I know this is now available as a histrogram on NCBIs site (thanks NCBI!) but its straightforward to replicate. esearch obtains an index of the documents matching the search, efetch gets the data, and xtract pulls out PubDate from the Document Summary. The dateformat is not 100% standard so it needs to be cleaned up a bit. Instead of turning to python/R I simply cut the data, and keep the first column. However I noticed a few dates like “1990-1991” which need to be further cleaned with a second cut using the dash ("-") as a delimiter. The resulting stream of years (2011\n2011\n2012\n....) gets piped into a simple barchart script. To create a year-by-year histogram. The code for plotting the graphs below is available here.
esearch -db pubmed -query "ebola" | \
  efetch -format docsum | \
  xtract -pattern DocumentSummary -element PubDate | \ #"2015 Jan"
  cut -d " " -f 1 | \                                  #"2015 Jan" -> "2015"
  cut -d "-" -f 1 | \                                  #"2011-2012" -> "2011"
  python hist.py --title "ebola" --outfile "eutilsbar_ebola.png"
In the case of ebola, there is a massive surge in articles in 2014-2015 which is not terrible surprising since that corresponds with articles following the outbreak. Theres got to be a fair number of opinion pieces and news articles in that index as there is no way that 1000 research papers on ebola were sitting tight until the opportune moment.
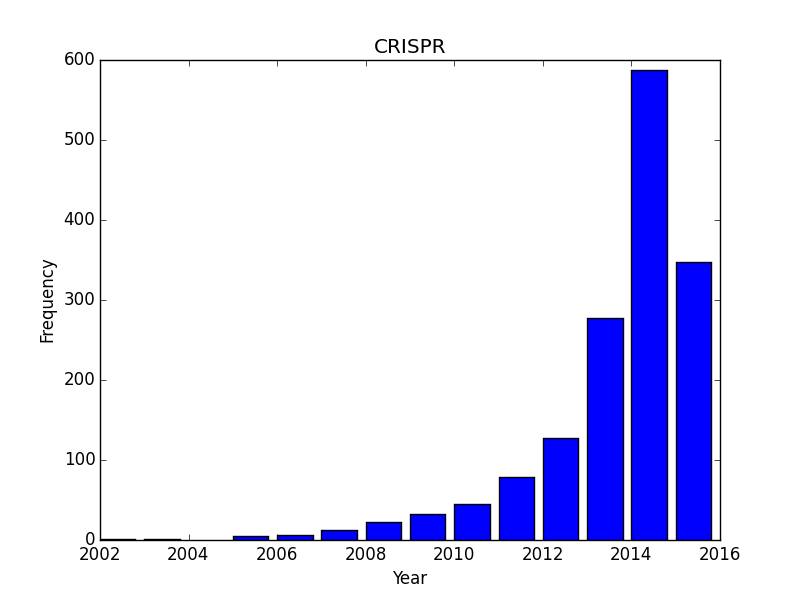
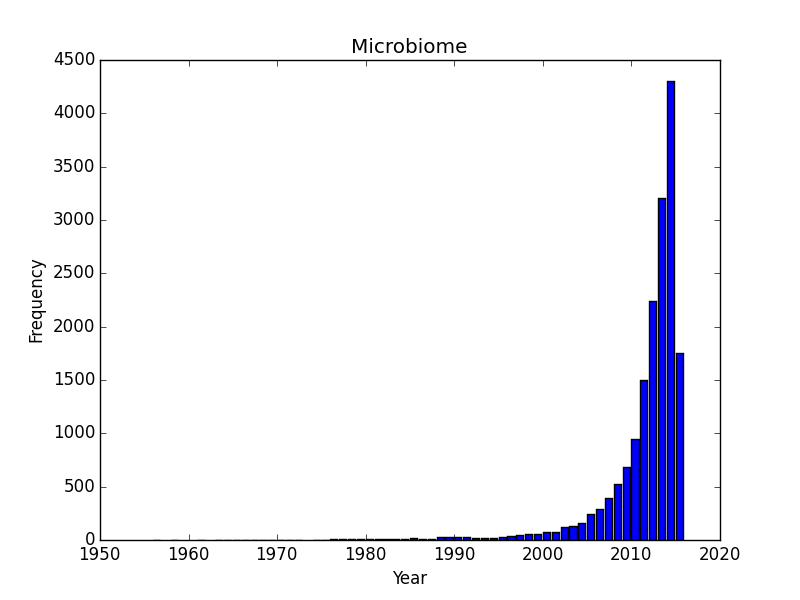
Now that I have the script I though i’d play with a few other search terms: how about hot topics like “CRISPR”, and “microbiome”? Both of these are experiencing incredible buzz right now as technological developments and excitement are driving an incredible investment in both types of research. These more exponential-looking curves probably have their fair share of commentary but also represents widespread adoption/interest in the research community (as opposed to the abrupt year-over-year transition for ebola.)
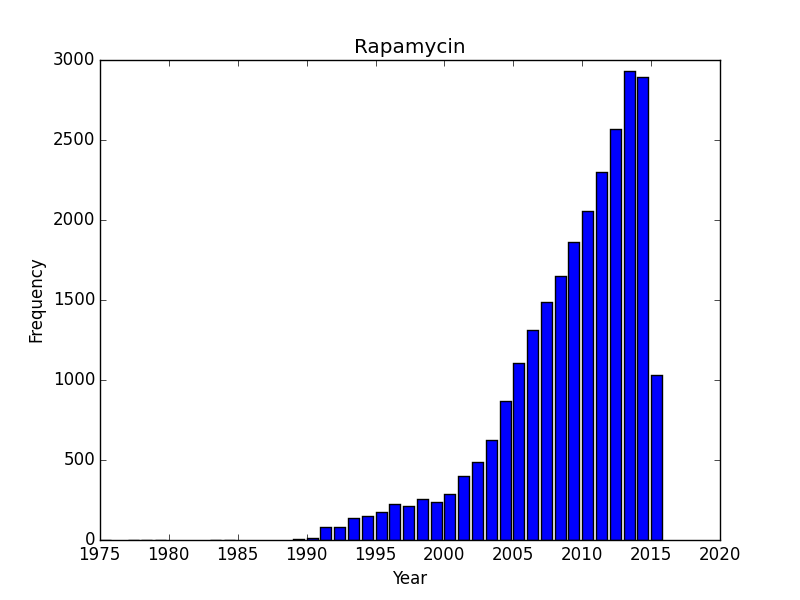
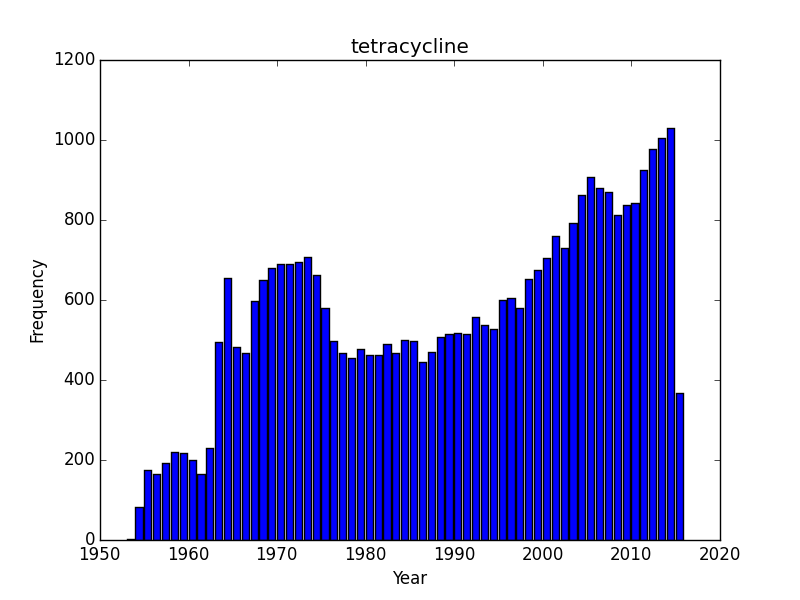
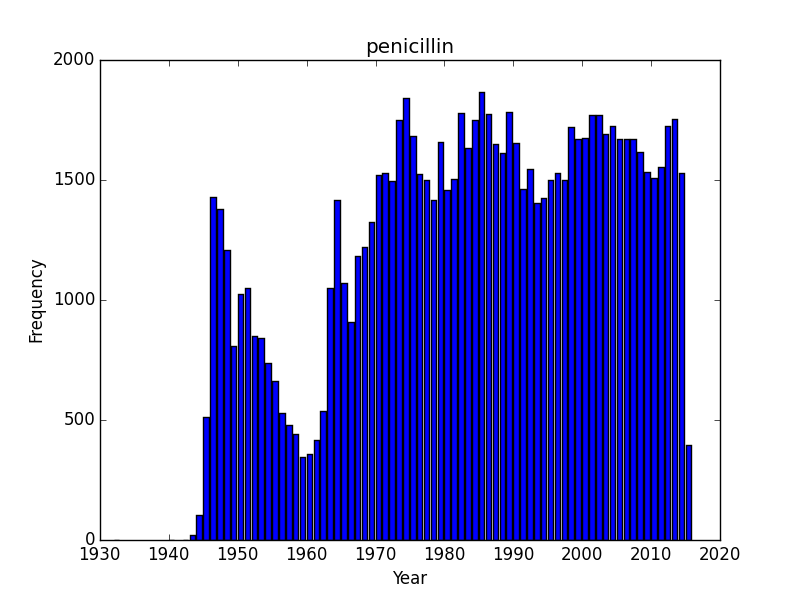
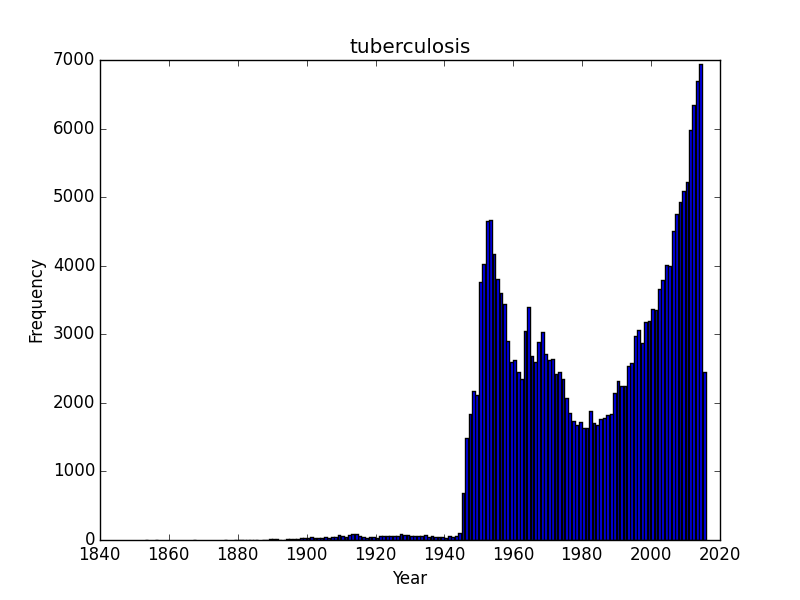
Do all search topics increase over time as a result of simple more papers being put out? Lets check a few search terms related to natural products/antibiotics or infectious diseases? I started with Rapamycin and was somewhat surprised to see that it was rising, and quickly. Rapamycin is probably still benefiting from a large numbers of studies on immune suppression and continues to be the subject of scientific inquiry. What about two other antibiotics, tetracycline and penicillin, or an infectious disease, tuberculosis? These are interesting as we can see trends that I would imagine correspond with outbreaks. I am somewhat baffled by sharp dips in the timelines for penicillin and tuberculosis. Following an initial wave of popularity and excitement in the 1950’s, penicillin dips down in the 1960’s only to surge in interest again. Tuberculosis experiences as similar post-war surge of interest, a drop off that doesn’t reverse until the 1980’s and a contemporary surge of interest. These are curious/interesting trends.
Does the 1960’s low for penicillin correspond with the awareness of the problems of resistance and the rise of research into 2nd and 3rd generation beta-lactams? And why would the attention towards tuberculosis drop off in the 1980’s? The recent rise probably corresponds with the growing, scary scourge of MDR and XMDR and the renewed interest in strategies to combat this disease. However, its hard to make too much of this data until we know a bit more about the database. Form the TB graph, for instance I would be suspicious that in the 1940’s there wasn’t just a much greater number of journals that were indexed, or an explosion of medical journals. But the trends beginning the 1980’s and 1990’s probably reflect some true-rate of interest.
This post demonstrates that a little but of understanding of the eutils CLI (and some datamunging/graphing) can let you tap into the wealth of NCBI’s many databases. The documentation on NCBIs website is an excellent starting point and demonstrates how flexible these command line utilities can be.