NCI60-Drug-Toxicity
The National Cancer Institute provides a number of datasets that are freely available for download. One of these, the NCI60 Compound Activity dataset assesses the growth inhibition caused by a large number of compounds on 60 cancer cell lines (the NCI60 cell lines). To play with this data, I created an R package that will allow you to peruse this data set and ask some basic questions. My intention is to write up a few blog posts about this dataset - basically writing up some exploratory data analysis.
Loading the data#
#load the package
#data should then be avaiable via lazyload
library(devtools)
install_github("zachcp/nci60-drugtox")
library("NCI60.drugtox")
library(dplyr)
library(ggplot2)
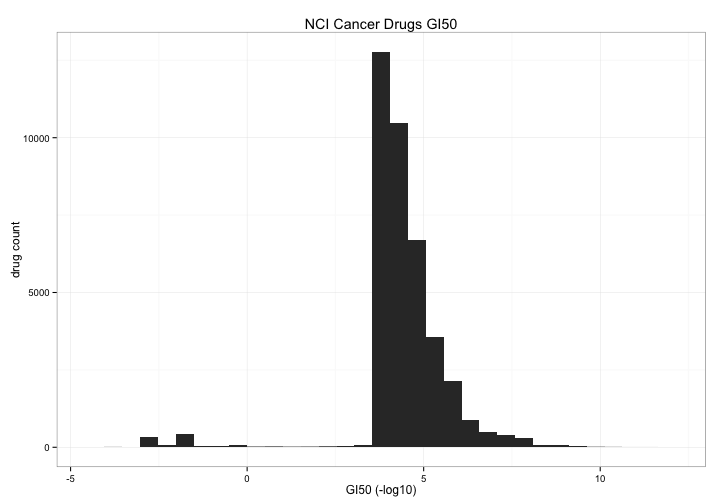
The actual data is a sulforhodamine B assay that measures Growth Inhibition: “[values shown below are the] negative log10 (GI50) values of sulforhodamine B assay for ~ 50K compounds, including more than 20,000 that passed quality control, 158 Food and Drug Administration approved and 79 clinical trial drugs. Higher values equate to higher sensitivity of cell lines.”
Lets take a look.
Overview of Toxicity By Compound#
The first thing we can take a look at is the general distribution of toxicity of all of the drugs in the study. I count 39072 drugs (by NSC.id) but only 1024 have a toxicity score < 0 , about 2.5% What are those compounds and do they act on particular cell lines or tissues?
#data can be accessed lazily as `nci60`
#average toxicity of the compounds
nci60 %>%
    select(NSC.id,toxicity) %>%
    group_by(NSC.id) %>%
    summarize(tox = mean(toxicity)) %>%
    ggplot(aes(x=tox)) +
      geom_bar()  +
      theme_bw() +
      xlab("GI50 (-log10)") +
      ylab("drug count") +
      ggtitle("NCI Cancer Drugs GI50")
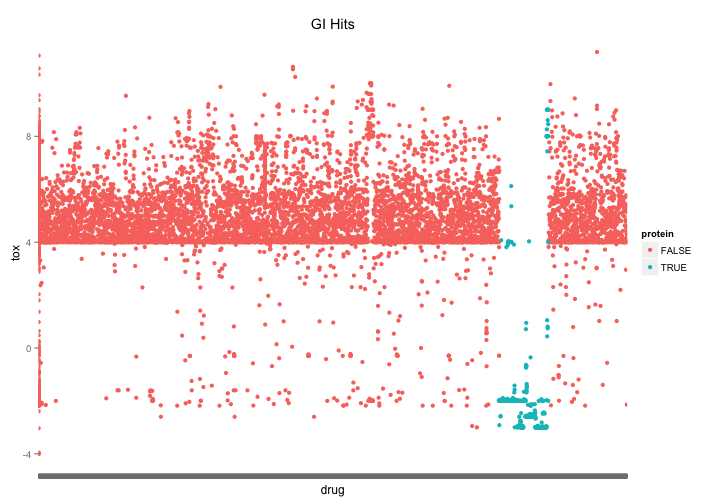
The first thing I notice when looking at the most potent hits is that there are a whole lot of recombinant protein entries. If we vizualize them we notice that there is section of the list clustered around the name “recombinant protein…” and that these proteins are heavily represented among the most potent compounds.
nci60 %>%
    mutate(protein=grepl("^recombinant", drug, ignore.case=TRUE)) %>%
    group_by(NSC.id, drug,protein) %>%
    summarize(tox = mean(toxicity)) %>%
    ggplot( aes(x=drug,y=tox, color=protein)) +
      geom_point() +
      theme(axis.text.x = element_blank()) +
      ggtitle("GI Hits")
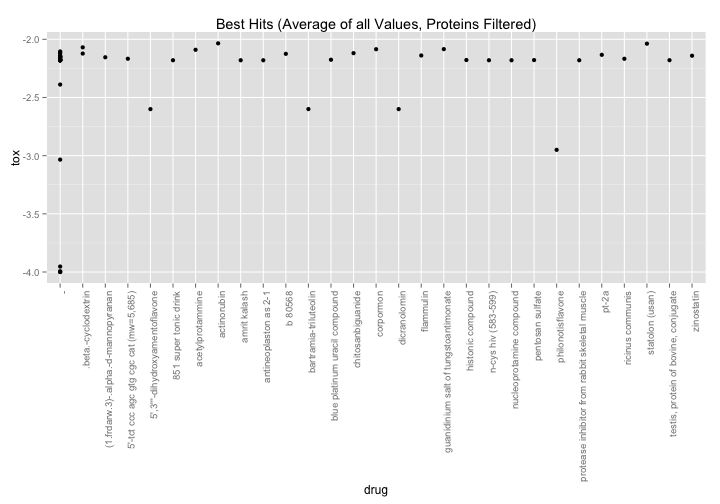
nci60 %>%
    filter(grepl("(recombinant|immune|mixture|extracted|pin)",drug,ignore.case=TRUE) == FALSE) %>%
    group_by(NSC.id, drug) %>%
    summarize(tox = mean(toxicity)) %>%
    filter(tox < -2) %>%
    ggplot( aes(x=drug,y=tox)) +
      geom_point() +
      theme(axis.text.x = element_text(angle=90,hjust=1)) +
      ggtitle("Best Hits (Average of all Values, Proteins Filtered)")
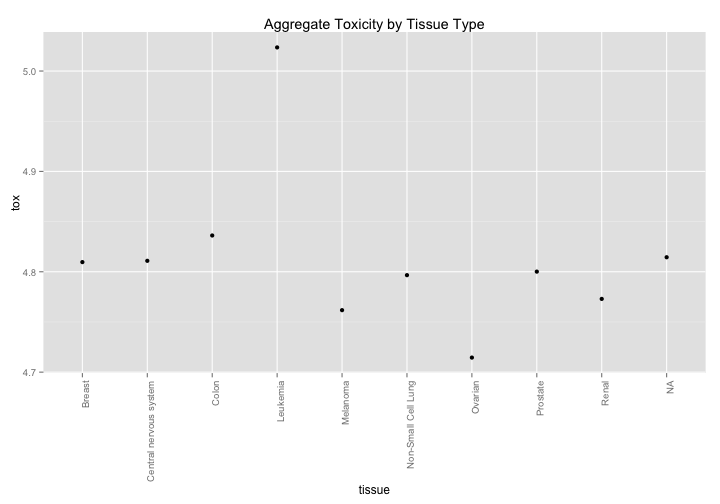
Toxicity By Tissue#
The NCI60 has cell line metadata that allows you to look at data by tissue of origin. Are there any interesting findings that pop out? Aggregated data suggests that leukemia is less affected by drugs while ovarian tissue is more susceptible, although this effect is relatively small (log scale).
nci60 %>%
    group_by(tissue) %>%
    summarize(tox = mean(toxicity)) %>%
    ggplot(aes(x=tissue,y=tox)) +
      geom_point() +
      theme(axis.text.x = element_text(angle=90,hjust=1)) +
      ggtitle("Aggregate Toxicity by Tissue Type")
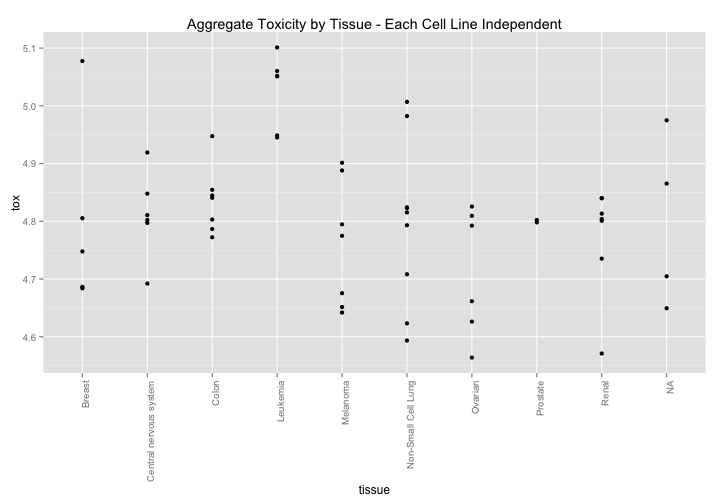
What if we break this down by celltype? Here is an interesting pattern. There seems to be a slight general sensitivity across tissues types. Might there be some broad variable that could explain cellular health? Lets take a look at p53.
nci60 %>%
    group_by(tissue,cell.line) %>%
    summarize(tox = mean(toxicity)) %>%
    ggplot(aes(x=tissue,y=tox)) +
      geom_point() +
      theme(axis.text.x = element_text(angle=90,hjust=1)) +
      ggtitle("Aggregate Toxicity by Tissue - Each Cell Line Independent")
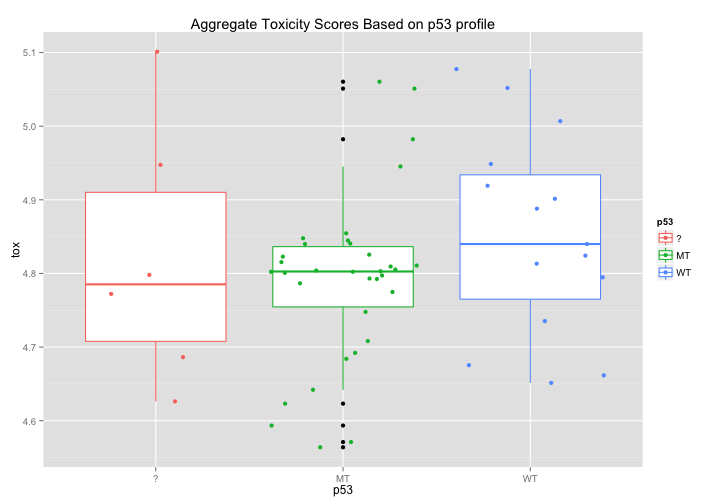
p53: Does p53 affect drug toxicity?#
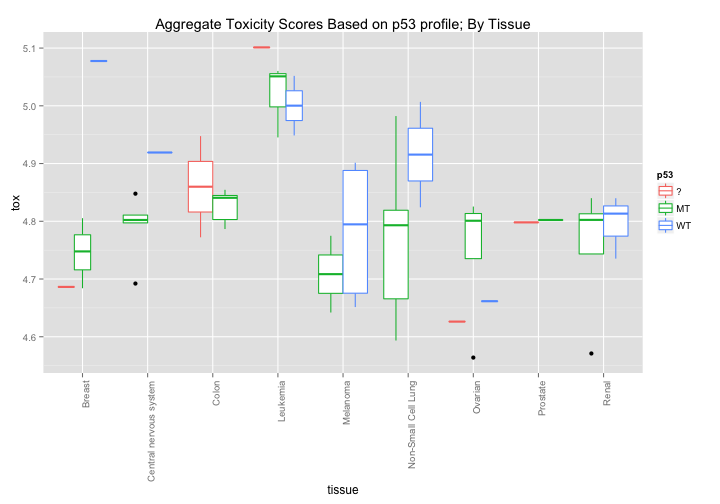
Each cell line has been scored for whether or not its p53 is mutated or WildType. Might there be some simple correlation between p53 status and broad toxicity? The first graph would seem to suggest that that Mutant p53 cell lines are, on average, slightly more sensitive to drugs. The second graph breaks down this response even further and seems to highlight certain tissue types where p53 induces a noticeable difference in average drug sensitivity - notably in melanoma and non-small cell lung cancer cell lines.
nci60 %>%
    filter(p53!="NA") %>%
    group_by(cell.line, p53) %>%
    summarize(tox = mean(toxicity)) %>%
    ggplot(aes(x=p53,y=tox, color=p53)) +
    geom_boxplot() + geom_jitter() +
    ggtitle("Aggregate Toxicity Scores Based on p53 profile")
nci60 %>%
    filter(p53!="NA") %>%
    group_by(tissue,cell.line, p53) %>%
    summarize(tox = mean(toxicity)) %>%
    ggplot(aes(x=tissue,y=tox, color=p53)) +
      geom_boxplot() +
      theme(axis.text.x = element_text(angle=90,hjust=1)) +
      ggtitle("Aggregate Toxicity Scores Based on p53 profile; By Tissue")
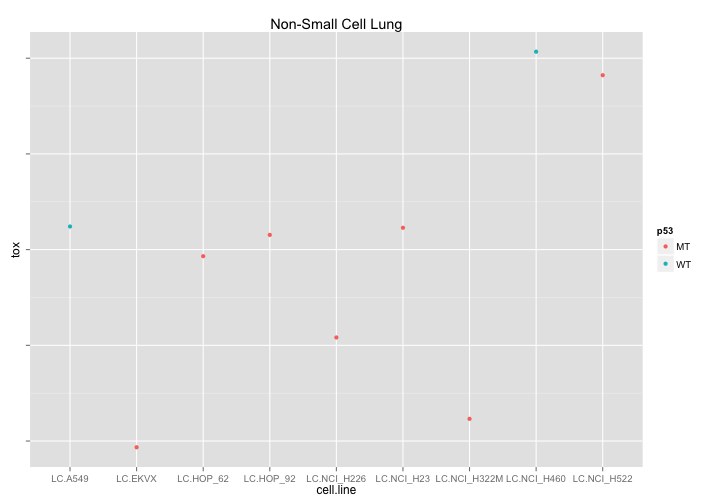
What if we try to look at drugs affecting Non-small cell lung cancer that are different in p53-Wt and p53 Mutant cell lines. Well - its good to look at this data because now we can see that out WT cell data consists of only two cell lines and that the difference we previously observed is therefore unreliable.
nci60 %>%
    filter(tissue =="Non-Small Cell Lung") %>%
    group_by(cell.line, p53) %>%
    summarize(tox = mean(toxicity)) %>%
    ggplot(aes(x=cell.line,y=tox, color=p53)) +
      geom_point() +
      theme( axis.text.y = element_blank()) +
      ggtitle("Non-Small Cell Lung")
Recap#
The NCI60 Drug Toxicity dataset is a great dataset for exploratory analysis and just by walking through the data a bit its possible to see some potential leads on interesting stories to look at. There is quite a bit more data in this dataset including a mechanism of action activity (I may need to add that, actually) and of course it is possible to cross reference the chemical data using the pubchem id field. I’ll take a look at those in a future post.git st